Helping Baltimore Volunteers Find Where to Help
Overview
Bloomberg Government analysts put together a prototype through the Census Bureau’s Opportunity Project to better assess where volunteers should direct litter-clearing efforts. Using Census Bureau and Forest Service information, the team brought a data-driven approach to their work. Their experience reveals how individuals with data expertise can identify a real-world problem that data can help solve, navigate across agencies to find and obtain the most useful data, and work within resource constraints to provide a tool to help address the problem.
Source
Details
Originally published April 26, 2019
The City of Baltimore features great community spaces, but it suffers from a litter problem. Wrappers, bottles, bags, and other urban detritus build up over time, taking away from the otherwise terrific experience of visiting these treasured spots. Luckily, there are community groups and others interested in keeping things clean for the benefit of all. The problem is that people who want to help need help themselves to find where their efforts are needed. Recently, Bloomberg Government analysts put together a prototype through the Census Bureau’s Opportunity Project to better assess where volunteers should direct their efforts. Using Census Bureau and Forest Service information, the team brought a data-driven approach to their work. Their experience reveals how individuals with data expertise can identify a real-world problem that data can help solve, navigate across agencies to find and obtain the most useful data, and work within resource constraints to provide a tool to help address the problem.

DEVOPL jumps off from the realization that there is a mismatch between where litter is worst and where volunteer groups tend to visit.
Optimizing volunteerism
Bloomberg’s Peter Brusoe, a Campaign Finance and Lobbying Data Analyst, likes to volunteer in his Baltimore community. One Saturday afternoon, he met up with a group of other civic-minded Baltimore residents to clean the litter from a popular waterside park. While these engagements usually take most of the day, the team was puzzled to find that they were done before lunch. Peter realized that another group of volunteers must have visited recently.
Peter had stumbled onto an important insight – if volunteer groups were cleaning up the same parks, they were doing redundant work and might be missing sites that really needed more visits. Some indicator of need, based on amount of litter or most recent visit from another volunteer group, would have been helpful in directing his group to a more under-served site than the waterside park.
Peter recalled this experience when a colleague pointed out that The Opportunity Project was looking for collaborators to leverage Census Bureau data for a project that would help improve the environment.
Where are the volunteers?
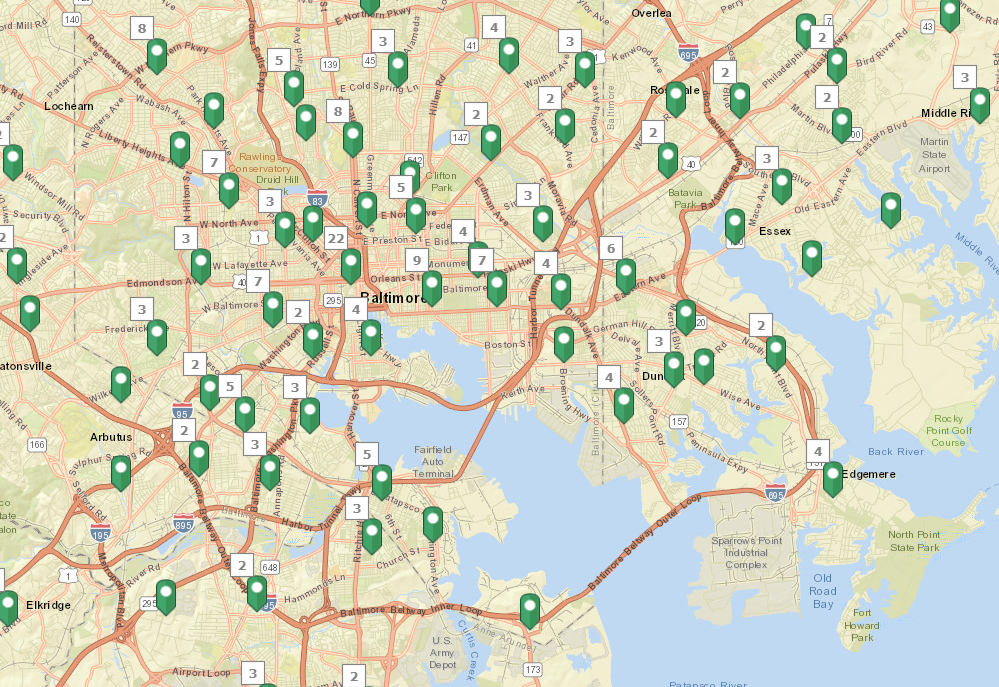
The Opportunity Project connected Peter with data experts from the Census Bureau and the Forest Service. The Forest Service hosts the annual Stewardship Mapping and Assessment Project (STEW-MAP), which lists different non-profit organizations that are active in performing environmental protection, education, and remediation efforts. Although the project offered an overview of organizations that are active in the area, it was limited in several key respects. It only provided information about the headquarters of the organizations with no indication of where they were doing their activities or what type of activities they were doing. In some cases, only the central administration building was provided without mention of other organization sites. Several schools, for instance, were geolocated to the address of their administration buildings, not to the location of their actual campuses.
The Bloomberg team decided to better map in real time what the organizations were doing and what activities they were performing.
An indicator of litter risk
A great deal of the trash removed from parks is consumer-driven waste, like plastic bottles, plastic bags, sandwich wrappers, chip wrappers, and other food waste products. It made sense to look at small grocery stores that sell readymade food, single containers, and sports drinks as hotspots for this sort of litter. The team hypothesized that a single-use item purchased at this type of store has a high chance of being consumed, then discarded, within several blocks of the store. Working with Data Advocates inside the Census Bureau (experts on the types of data the Bureau collects and disperses), Peter was able to use data from the quinquennial business survey and the monthly survey of economic data to find the concentration of these stores in local areas. This allowed the team to confirm the prediction that convenience store concentration is indicative of higher litter risk.
With an idea of where non-profit organizations are based and where small grocery stores are located, a tool could spatially indicate areas that need volunteer work.

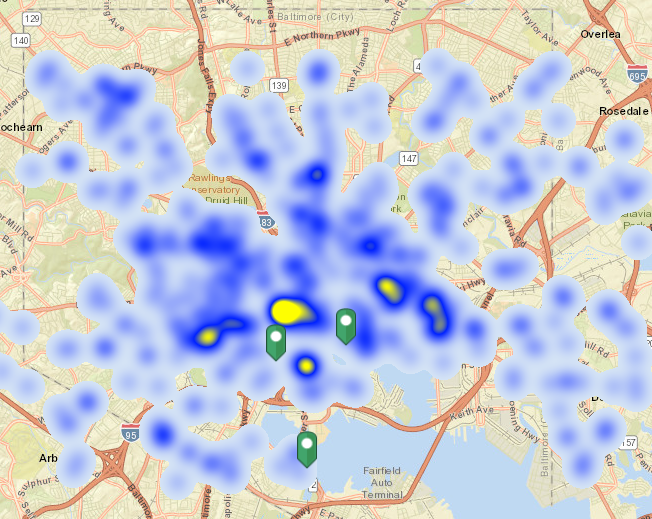
Convenience store locations are used to predict areas of prevalent litter
The mismatch between volunteer traffic and litter risk
Next, the team needed a way to map out where volunteer and community groups were currently active. To get an idea of these already-served areas, they started with locations from the STEW-MAP project and then added some select service event data from a few community groups as a proof of concept. In an ideal world, the ‘need’ indicator would overlap heavily with the ‘supply’ of volunteerism, but the results from the proof of concept showed that this was not the case. Volunteer activities were not located in the areas of greatest need.
Keep it simple
With their data-backed problem definition in hand, the team went to work building a custom-coded tool that would map out communities’ cleanup needs along with indicators of current service level. It wasn’t long, however, before Peter stepped back to reassess. Over the course of the preceding months, his team (volunteers themselves) had experienced some attrition, shrinking from ten to three, forcing the team to re-prioritize the work. They all had experience working with ESRI’s ArcGIS and, in fact, had done most of their initial problem mapping in the software. They made the decision to abandon a custom-built codebase and design the system on top of ArcGIS and Google Sheets. The result wasn’t as feature-rich as they initially planned, but it certainly got the job done in a more streamlined way. The tool would not only help volunteer groups better align their efforts with the level of predicted litter in communities, but it would improve over time, as it encouraged groups to log their activities with the tool and keep it up to date.
“I often found the short timeline stressful, but it did force us to make the time-saving, use-what-you-have decisions so important in creating an MVP.”
— Peter Brusoe
What’s next
The Bloomberg team is working with Baltimore non-profits to help test the MVP during the upcoming spring, summer, and fall months. The nicer weather sees an uptick in community cleanups and volunteerism, as well as an increase in usage of green spaces. Bloomberg maintains active volunteer partnerships with Blue Water Baltimore, Parks & People, Civic Works and Living Classrooms. With this feedback, the team hopes to improve the MVP and cleanups, focusing on underserved areas.
The Bloomberg team enjoyed working with The Opportunity Project and looks forward to future collaborations.
Postscript
To learn more about this project, check it out on The Opportunity Project or contact Pbrusoe@Bloomberg.net. Peter W. Brusoe is a Global Data Analyst at Bloomberg Government. While Bloomberg Philanthropies is an Opportunity Project partner, Peter and team worked on this project on their own time.
The Opportunity Project is a process for engaging government, communities, and the technology industry to create digital tools that address our greatest challenges as a nation. This process helps to empower people with technology, make government data more accessible and user-friendly, and facilitate cross-sector collaboration to build new digital solutions with open data.
To receive updates on activities related to the Federal Data Strategy, please sign up for the newsletter.
The Federal Data Strategy Incubator Project
The Incubator Project helps federal data practitioners think through how to improve government services, enabling the public to get the most out of federal data. This Proof Point and others will highlight the many successes and challenges data innovators face every day, revealing valuable lessons learned to share with data practitioners throughout government.

